An official website of the United States government
Here’s how you know
Official websites use .gov
A .gov website belongs to an official government organization in the United States.
Secure .gov websites use HTTPS
A lock (
) or https:// means you’ve safely connected to the .gov website. Share sensitive information only on official, secure websites.
-
//
- Census.gov /
- Newsroom /
- News Releases /
- Pacific Coast & Most Northeast States Lead in Broadband Internet Use
Pacific Coast & Most Northeast States Lead in Broadband Internet Use
For Immediate Release: Monday, September 11, 2017
Pacific Coast & Most Northeast States Lead in Broadband Internet Use
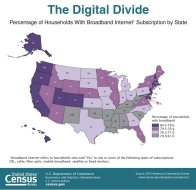
SEPT. 11, 2017 — States on the Pacific Coast and most of those in the Northeast such as New Hampshire and Massachusetts had higher levels of broadband internet use compared to the national average (77 percent), according to a new U.S. Census Bureau report on Computer and Internet Use in the United States: 2015. These tended to be the states with higher incomes compared to the national average. Utah and Colorado were also states with higher percentages of households with broadband subscription.
“High income states tend to have high levels of broadband internet use, but some places don’t fit the pattern because demographic and social differences also come into play,” said Camille Ryan, a demographer in the Social, Economic and Housing Statistics Division at the Census Bureau. “The District of Columbia, for example, had high household income, while the household income in Idaho was below the national average, yet for both places, broadband subscription rate was not statistically different from the national average.”
However, states with the lowest rates of broadband internet use such as Mississippi (61 percent), Arkansas (64 percent), and New Mexico (67 percent) had lower median household incomes.
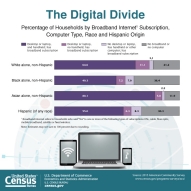
Among race and Hispanic origin groups, Asians were the most likely to have a desktop or laptop, handheld device and broadband subscription. About 80 percent reported this combination of the three key items. Sixty-five percent of whites reported all three items, compared with 55 percent of Hispanics and 49 percent of blacks.
“It’s interesting to note that households connected to the internet but without a desktop or laptop relied on a handheld devise or smartphones alone for internet connectivity,” said Ryan. Younger households were more likely to be in this group (8 percent of households with householders ages 15 to 34, versus two percent of households with householders age 65 and older).
“Low-income households had the lowest overall connectivity, but the highest proportion of “handheld only” households,” added Ryan. “Similarly, black and Hispanic households had relatively low connectivity overall but high proportions of handheld only households. As mobile devices continue to evolve and increase in popularity, it will be interesting to see what happens with this group.”
This report examines key trends and characteristics of computer and internet use using data from the Current Population Survey and the American Community Survey. Current Population Survey data provide historical context and data from the American Community Survey highlight more current characteristics.
Other highlights from the report using American Community Survey data:
- Among all households, 78 percent had a desktop or laptop, 75 percent had a handheld computer such as a smartphone or other handheld wireless computer, and 77 percent had a broadband internet subscription.
- Households headed by a person age 65 years and older lagged behind households with younger householders in computer ownership or use and the likelihood of having an internet subscription.
- Households in metropolitan areas were more likely to report owning or using a desktop or laptop or a handheld device and subscribing to broadband internet compared to their nonmetropolitan counterparts.
- Overall, 62 percent of American households had “high connectivity,” meaning they had three key computer and internet items: a desktop or laptop, a handheld computer or smartphone, and a broadband internet subscription. High connectivity was highest among households where the householder was less than 65 years old or had a household income of $150,000 or more.
Both computer and internet use have increased since the Current Population Survey began collecting data on computer use in the 1980s and internet use in the 1990s. The American Community Survey began collecting these data in 2013 and provides annual estimates for geographic areas with populations of 65,000 and greater. For more information on the American Community Survey sample design and other topics, visit <www.census.gov/acs/www>.
###
Share
Contact
Julie Iriondo/Jewel Jordan
Public Information Office
301-763-3030
pio@census.gov
Related Information
 Yes
Yes
 No
NoComments or suggestions?


Top


