Facts for Features: American Indian and Alaska Native Heritage Month, November 2013
The first American Indian Day was celebrated in May 1916 in New York. Red Fox James, a Blackfeet Indian, rode horseback from state to state, getting endorsements from 24 state governments, to have a day to honor American Indians. In 1990, President George H.W. Bush signed a joint congressional resolution designating November 1990 as "National American Indian Heritage Month." Similar proclamations have been issued every year since 1994. This Facts for Features presents statistics for American Indians and Alaska Natives, as this is one of the six major race categories.
Note: Unless otherwise specified, the statistics in the "Population" section refer to the population who reported a race alone or in combination with one or more other races.
Population
5.2 million
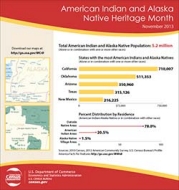
The nation's population of American Indians and Alaska Natives, including those of more than one race. They made up about 2 percent of the total population in 2012. Of this total, about 49 percent were American Indian and Alaska Native only, and about 51 percent were American Indian and Alaska Native in combination with one or more other races.
Source: 2012 American Community Survey
<//factfinder2.census.gov/bkmk/table/1.0/en/ACS/12_1YR/S0201//popgroup~009>
11.2 million
The projected population of American Indians and Alaska Natives, alone or in combination, on July 1, 2060. They would comprise 2.7 percent of the total population.
Source: Population projections
<//www.census.gov/population/projections/files/summary/NP2012-T4.xls>
437,339
The American Indian and Alaska Native population, alone or in combination 65 and over.
Source: 2012 American Community Survey
<//factfinder2.census.gov/bkmk/table/1.0/en/ACS/12_1YR/S0201//popgroup~009>
14
Number of states with more than 100,000 American Indian and Alaska Native residents, alone or in combination, in 2012. These states were California, Oklahoma, Arizona, Texas, New Mexico, Washington, New York, North Carolina, Florida, Alaska, Michigan, Oregon, Colorado and Minnesota.
Source: 2012 American Community Survey
<//factfinder2.census.gov/bkmk/table/1.0/en/ACS/12_1YR/S0201/0100000US.04000/popgroup~009>
19.6%
The proportion of Alaska's population identified as American Indian and Alaska Native, alone or in combination, in 2012, the highest rate for this race group of any state. Alaska was followed by Oklahoma (13.4 percent), New Mexico (10.4), South Dakota (10.0 percent) and Montana (8.1 percent).
Source: 2012 American Community Survey
<//factfinder2.census.gov/bkmk/table/1.0/en/ACS/12_1YR/DP05/0100000US.04000>
31.0
Median age for those who were American Indian and Alaska Native, alone or in combination, in 2012. This compares with a median age of 37.4 for the U.S. population as a whole.
Sources: 2012 American Community Survey
<//factfinder2.census.gov/bkmk/table/1.0/en/ACS/12_1YR/S0201//popgroup~009>
Reservations
325
Number of federally recognized American Indian reservations in 2012. All in all, excluding Hawaiian Home Lands, there are 618 American Indian and Alaska Native legal and statistical areas for which the Census Bureau provides statistics.
Source: Census Bureau Geography Division
22%
Percentage of American Indians and Alaska Natives, alone or in combination, who lived in American Indian areas or Alaska Native Village Statistical Areas in 2010. These American Indian areas include federal American Indian reservations and/or off-reservation trust lands, Oklahoma tribal statistical areas, tribal designated statistical areas, state American Indian reservations, and state designated American Indian statistical areas.
Source: 2010 Census Summary File 1
Tribes
566
Number of federally recognized Indian tribes.
Data courtesy of the Bureau of Indian Affairs
<//www.bia.gov/cs/groups/public/documents/text/idc015898.pdf> [PDF - <1.0 MB]
Families
1,122,043
The number of American Indian and Alaska Native family households in 2012 (households with a householder who was American Indian and Alaska Native alone or in combination with another race). Of these, 54.7 percent were married-couple families, including those with children.
Source: 2012 American Community Survey
<//factfinder2.census.gov/bkmk/table/1.0/en/ACS/12_1YR/S0201//popgroup~009>
6.2%
The percentage of American Indian and Alaska Natives alone or in combination with other races who were grandparents living with their grandchild(ren) in 2012.
Source: 2012 American Community Survey
<//factfinder2.census.gov/bkmk/table/1.0/en/ACS/12_1YR/S0201//popgroup~009>
Housing
54.0%
The percentage of single-race American Indian and Alaska Native householders who owned their own home in 2012. This is compared with 63.9 percent of the overall population.
Source: 2012 American Community Survey
<//factfinder2.census.gov/bkmk/table/1.0/en/ACS/12_1YR/S0201//popgroup~009>
Languages
20.4%
Percentage of American Indians and Alaska Natives alone or in combination 5 years and older who spoke a language other than English at home in 2012, compared with 21 percent for the nation as a whole.
Source: 2012 American Community Survey
<//factfinder2.census.gov/bkmk/table/1.0/en/ACS/12_1YR/S0201//popgroup~009>
Education
78.8%
The percentage of single-race American Indians and Alaska Natives 25 and older who had at least a high school diploma, GED certificate or alternative credential in 2012. In addition, 13.5 percent obtained a bachelor's degree or higher. In comparison, 86.4 percent of the overall population had a high school diploma and 29.1 percent had a bachelor's degree or higher.
Source: 2012 American Community Survey
<//factfinder2.census.gov/bkmk/table/1.0/en/ACS/12_1YR/S0201//popgroup~006>
40.9%
Single-race American Indians and Alaska Natives 25 and older whose bachelor's degree was in science and engineering, or science and engineering-related fields in 2012. This compares with 43.6 percent for all people 25 and older with this level of education.
Source: 2012 American Community Survey
<//factfinder2.census.gov/bkmk/table/1.0/en/ACS/12_1YR/C15010C>
70,532
Number of single-race American Indians and Alaska Natives 25 and older who had a graduate or professional degree in 2012.
Source: 2012 American Community Survey
<//factfinder2.census.gov/bkmk/table/1.0/en/ACS/12_1YR/S0201//popgroup~006>
Jobs
26.1%
The percentage of civilian-employed single-race American Indian and Alaska Native people 16 and older who worked in management, business, science and arts occupations in 2012. In addition, 25.1 percent worked in service occupations and 22.8 percent in sales and office occupations.
Source: 2012 American Community Survey
<//factfinder2.census.gov/bkmk/table/1.0/en/ACS/12_1YR/S0201//popgroup~006>
Veterans
161,686
The number of single-race American Indian and Alaska Native veterans of the U.S. armed forces in 2012.
Source: 2012 American Community Survey
<//factfinder2.census.gov/bkmk/table/1.0/en/ACS/12_1YR/B21001C>
Income and Poverty
$35,310
The median household income of single-race American Indian and Alaska Native households in 2012. This compares with $51,371 for the nation as a whole.
Source: 2012 American Community Survey
<//factfinder2.census.gov/bkmk/table/1.0/en/ACS/12_1YR/S0201//popgroup~006>
29.1%
The percent of single-race American Indians and Alaska Natives that were in poverty in 2012, the highest rate of any race group. For the nation as a whole, the poverty rate was 15.9 percent.
Source: 2012 American Community Survey
<//factfinder2.census.gov/bkmk/table/1.0/en/ACS/12_1YR/S0201//popgroup~002|004|006|009|012>
Health Insurance
27.4%
The percentage of single-race American Indians and Alaska Natives who lacked health insurance coverage in 2012. For the nation as a whole, the corresponding percentage was 14.8 percent.
Source: 2012 American Community Survey
<//factfinder2.census.gov/bkmk/table/1.0/en/ACS/12_1YR/S0201//popgroup~006>
The following is a list of observances typically covered by the Census Bureau’s Facts for Features series:
| Black (African American) History Month (February) Super Bowl Valentine's Day (Feb. 14) Women's History Month (March) Irish-American Heritage Month (March)/ St. Patrick's Day (March 17) Earth Day (April 22) Asian/Pacific American Heritage Month (May) Older Americans Month (May) Mother's Day Hurricane Season Begins (June 1) Father's Day |
The Fourth of July (July 4) Anniversary of Americans With Disabilities Act (July 26) Back to School (August) Labor Day Grandparents Day Hispanic Heritage Month (Sept. 15-Oct. 15) Unmarried and Single Americans Week Halloween (Oct. 31) American Indian/Alaska Native Heritage Month (November) Veterans Day (Nov. 11) Thanksgiving Day The Holiday Season (December) |
Editor’s note: The preceding data were collected from a variety of sources and may be subject to sampling variability and other sources of error. Facts for Features are customarily released about two months before an observance in order to accommodate magazine production timelines. Questions or comments should be directed to the Census Bureau’s Public Information Office: telephone: 301-763-3030; or e-mail: pio@census.gov.


