
Official websites use .gov
A .gov website belongs to an official government organization in the United States.
Secure .gov websites use HTTPS
A lock (
) or https:// means you’ve safely connected to the .gov website. Share sensitive information only on official, secure websites.

Topics
Data & Maps
Surveys & Programs
Resource Library
Examining the Racial and Ethnic Diversity of Adults and Children
Examining the Racial and Ethnic Diversity of Adults and Children
Estimated reading time: 12 minutes
The 2020 Census shows the overall U.S. population in 2020 was more racially and ethnically diverse than it was a decade earlier. But how racially and ethnically diverse were different age groups within the population?
We will be able to explore this question more deeply when the 2020 Census Demographic and Housing Characteristics File (DHC) is released later this week. The DHC will feature totals of males and females at every age from under 1 to 99 (with groupings beyond that) for race and Hispanic origin groups. It will also provide the data tabulated for a wide variety of age groups crossed by race, Hispanic origin and sex. This will make it possible to examine trends for specific age groups such as young children (ages 0 to 4) and the population age 85 and over. The Census Bureau is developing a data visualization by age that explores racial and ethnic diversity at different geography levels.
In the meantime, we can explore the racial and ethnic diversity of two broad age groups currently available from the 2020 Census: the under-18 population and adults (18 and over). This analysis will focus on data for the 50 states; Washington, DC; and Puerto Rico (with the latter two treated as “state equivalents”).
Our information about adults (the 18-and-over or “voting-age” population) is from the 2020 Census Redistricting Data released in August 2021. For information on children, we subtract adults from the total population leaving us with the population under age 18.
In this blog, we will first explain what we mean by racial and ethnic diversity, and then we will examine the racial and ethnic diversity of these two major age groups using several measures — and show that the population under age 18 was more racially and ethnically diverse than the population 18 and over.
Defining Diversity
People may have different perceptions of what it means for a population to be diverse. In this blog, the concept of racial and ethnic diversity refers to representation and the relative size of different racial and ethnic groups within a population. Diversity is maximized when all groups are represented in an area and have equal shares of the population.
We have used several approaches to measure the racial and ethnic diversity of the U.S. population in the 2020 Census results. These include the diversity index, prevalence rankings, diffusion scores and prevalence maps. We now examine each of these diversity measures for the total population, the population under age 18 and the population 18 and over.
We cross tabulated these findings by eight racial and ethnic groups from the 2020 Census used in the diversity calculations:
- Hispanic or Latino of any race.
- White alone, non-Hispanic.
- Black or African American alone, non-Hispanic.
- American Indian and Alaska Native alone, non-Hispanic.
- Asian alone, non-Hispanic.
- Native Hawaiian and Other Pacific Islander alone, non-Hispanic.
- Some Other Race alone, non-Hispanic.
- Multiracial (or “Two or More Races”), non-Hispanic.
Diversity Index
The Diversity Index tells us how likely two people chosen at random will be from different race and ethnicity groups. For example, in 2010, there was a 54.9% chance that two people chosen at random would be from different racial and ethnic groups, while in 2020 there was a 61.1% chance.
Looking closer at the 2020 Census, the population age 18 and over had a Diversity Index score of 58.3%, while the population under age 18 had a Diversity Index score of 68.5%. At the national level, the younger population was more racially and ethnically diverse than the adult population.
Diversity Index by State by Voting Age
The figures below illustrate the distribution of the Diversity Index score by state for the populations age 18 and over (Figure 1) and under 18 (Figure 2). In both figures, there are five categories for the Diversity Index ranging from less than 35% (illustrated in very light green) to 65% or more (illustrated in very dark green). States with Diversity Index scores of 65% and higher are labeled in Figures 1 and 2.
Figure 1.
Figure 2.
These figures show:
- For the adult population, six states had a Diversity Index score of 65% or more: Hawaii (74.1%); California (69.8%); Nevada (68.8%); Washington, DC, a state equivalent (66.7%); Texas (66.5%); and Maryland (65.2%).
- For the under-18 population, 19 states or state equivalents had a 65% or more Diversity Index.
- Puerto Rico had the lowest Diversity Index score for both the adult population (2.3%) and the younger population (1.7%).
- Areas with higher racial and ethnic diversity for both the younger and older populations appeared to be concentrated in the West, South and Northeast regions.
Prevalence Ranking and Diffusion Score
The Prevalence Ranking and Diffusion Score are other methods used to measure racial and ethnic diversity.
- The Prevalence Ranking in Figure 3 depicts the percentage of the population that falls into the top three largest racial or ethnic groups.
- Then, we calculated the Diffusion Score by combining the percentages of the remaining racial and ethnic groups. The higher the Diffusion Score, the less concentrated the population in the three largest racial or ethnic groups.
In Figure 3, the colors of the bars represent the different racial and ethnic groups shown in the legend.
Nationally, the three most prevalent groups were the same for the total, under-18 and 18-and-over populations:
- The White alone, non-Hispanic population was the largest or most prevalent race or ethnic group.
- The Hispanic or Latino population was the second-most prevalent race or ethnic group.
- The Black or African American alone, non-Hispanic population was the third-most prevalent race or ethnic group.
However, there were noticeable differences in the size of each of these groups, with the second- and third-most prevalent groups making up a larger share of the younger population.
- The White alone, non-Hispanic group accounted for 57.8% of the total population, 60.8% of the 18-and-over population, and only 47.3% of the population under age 18.
- The Hispanic or Latino group was 18.7% of the total population, 16.8% of the adult population, and 25.7% of the under-18 population.
- The Black or African American alone, non-Hispanic group was 12.1% of the total population, 11.7% of adults, and 13.2% of the younger population.
Similarly, the Diffusion Score was higher for the under-18 population (13.8%) than for the adult population (10.7%) and total population (11.4%), indicating greater racial and ethnic diversity among younger people.
States, Counties and Geographic Distribution
Based on the Diversity Index, Prevalence Rankings and the Diffusion Score, it is evident that the population under age 18 exhibited higher levels of racial and ethnic diversity than the total population and adult population. This was even more evident when examining the second- and third-largest race and ethnic categories for states and counties across the country:
Figure 4.
(View a higher resolution image of Figure 4.)
- In all but eight states or state equivalents (Arizona; California; Washington, DC; Hawaii; Nevada; New Mexico; Texas; and Puerto Rico), the largest race or ethnic group for the population under age 18 was White alone, non-Hispanic.
- In Arizona, California, Nevada, New Mexico, Texas and Puerto Rico, Hispanic or Latino was the largest racial or ethnic group; the District of Columbia’s largest race or ethnic group was Black or African American alone, non-Hispanic; and Hawaii’s was Multiracial, non-Hispanic.
- Hispanic or Latino was the nation’s second-largest racial or ethnic group, followed by Black or African American alone, non-Hispanic and White alone, non-Hispanic.
- As for the third-largest race or ethnic group, there was more variation among the states. The most common group was Multiracial, non-Hispanic, followed by Hispanic or Latino and Black or African American alone, non-Hispanic.
- The state with the highest Diffusion Score was Hawaii at 29.3% and the lowest was Puerto Rico at 0.2%.
Figure 5.
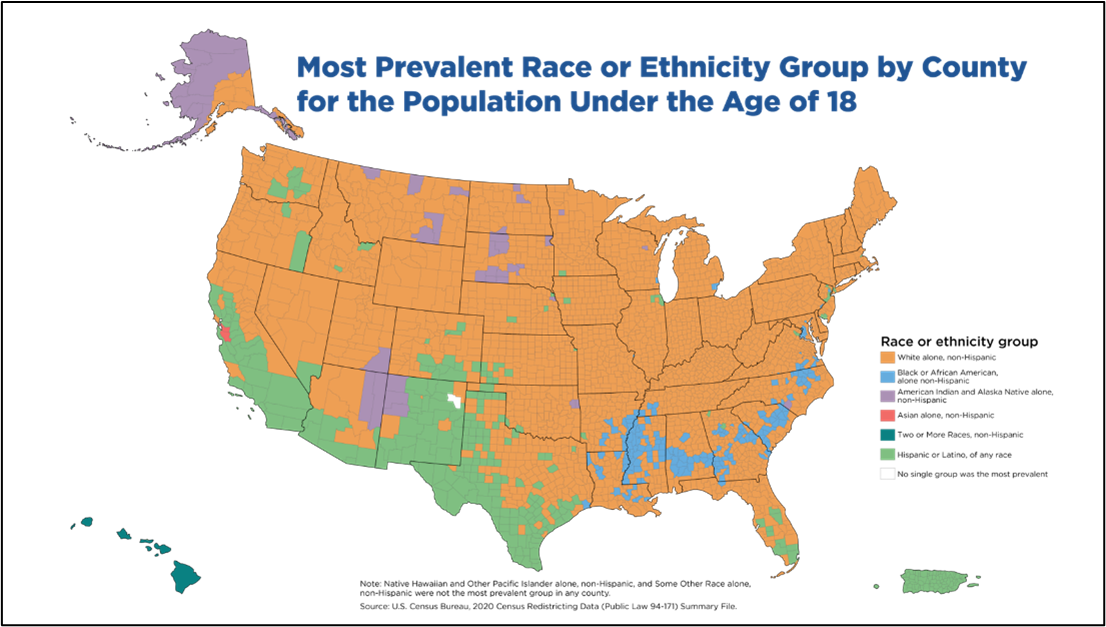
Looking at counties and county equivalents, the most prevalent race and ethnicity group for the population under age 18 was White alone, non-Hispanic. Counties where this group was most prevalent were distributed across most parts of the nation with the exception of:
- Hispanic or Latino in Puerto Rico, South Florida, much of the desert Southwest, and California.
- Black or African American alone, non-Hispanic in bands of counties in the interior South and lower Mississippi.
- American Indian and Alaska Native alone, non-Hispanic in rural counties in parts of the upper Midwest, Southwest and Alaska.
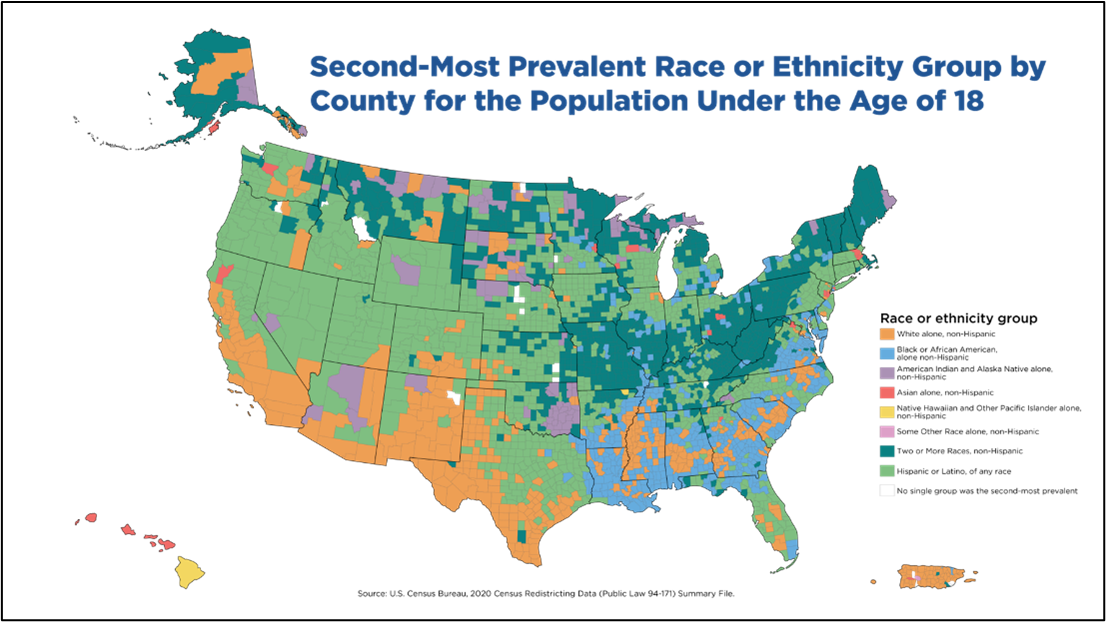
Figure 6.
Looking at counties and county equivalents, the most prevalent race and ethnicity group for the population under age 18 was White alone, non-Hispanic. Counties where this group was most prevalent were distributed across most parts of the nation with the exception of:
- Hispanic or Latino in Puerto Rico, South Florida, much of the desert Southwest, and California.
- Black or African American alone, non-Hispanic in bands of counties in the interior South and lower Mississippi.
- American Indian and Alaska Native alone, non-Hispanic in rural counties in parts of the upper Midwest, Southwest and Alaska.
Number of Counties by Race and Ethnicity Group Ranking
For our final analysis, we compared the number of counties where the different race or ethnic groups were the most and second-most prevalent for adults and people under age 18.
For example, Table 1 shows that:
- For the population under age 18, there were more counties where the most prevalent race and ethnic group was Hispanic or Latino; Black or African American alone, non-Hispanic; or American Indian and Alaska Native alone, non-Hispanic.
- There were four counties where the Multiracial, non-Hispanic population was the most prevalent group for the younger population and zero counties where it was true for adults.
- For three race/ethnic groups (Hispanic or Latino; White alone, non-Hispanic; and Multiracial, non-Hispanic), being second-most prevalent was more likely among the younger population than adults.
- Conversely, there were 857 counties where the second-most prevalent group among the adult population was Black or African American alone, non-Hispanic compared to 484 counties among the younger population.
Table 1.
| Prevalence Ranking of Racial and Ethnic Groups for Counties by Age: 2020 | ||||
| Racial and Ethnic Groups Used in Diversity Calculations |
Most Prevalent | Second Most Prevalent | ||
| Under 18 Years |
18 Years and Over | Under 18 Years |
18 Years and Over | |
| Hispanic or Latino | 237 | 104 | 1,168 | 1,097 |
| White Alone, non-Hispanic |
2,664 | 2,897 | 432 | 237 |
| Black or African American Alone, non-Hispanic |
189 | 108 | 484 | 857 |
| America Indian and Alaska Native alone, non-Hispanic | 45 | 29 | 95 | 126 |
| Asian Alone, non-Hispanic |
3 | 5 | 21 | 49 |
| Native Hawaiian and Other Pacific Islander Alone, non-Hispanic |
- | - | 2 | 1 |
| Some Other Race Alone, non-Hispanic |
- | - | - | - |
| Multiracial, non-Hispanic | 4 | - | 926 | 772 |
| Tie | 1 | - | 15 | 4 |
| Total | 3,143 | 3,143 | 3,143 | 3,143 |
Source: U.S. Census Bureau, 2020 Census Redistricting Data (Public Law 94-171) Summary File.
The Demography of Diversity
From these analyses, the 2020 Census reveals that in 2020 the population under age 18 was more racially and ethnically diverse than the population age 18 and over. Various measures such as the diversity index, prevalence rankings, diffusion score and prevalence maps indicate a potential social and demographic shift in the future for the United States. The findings for states and counties strengthen this supposition.
There are many demographic and social changes that contribute to the racial and ethnic composition and diversity of the population. These include immigration, multiracial relationships, trends in fertility, and aging. These demographic trends appear to have impacted the racial and ethnic diversity of people under age 18 more than adults.
Later this week, the Census Bureau plans to release 2020 Census data by even more age detail. This information will provide greater insight into social and demographic changes, including racial and ethnic diversity across age groups. We look forward to discovering more trends in racial and ethnic diversity by age and sharing them with the public.
Acknowledgment
In 2019, the U.S. Census Bureau’s Population Division formed the Measuring Racial and Ethnic Diversity Working Group, comprised of Census Bureau employees, to advance research on racial and ethnic diversity for the 2020 Census and beyond. This Working Group consists of race and ethnicity subject matter experts, demographers, statisticians and data visualization specialists, and develops strategies for producing racial and ethnic diversity statistics. The diversity measures included in this blog were developed through research and collaborative discussions among the authors, as well as consultations with external experts and advisors. The blog was written by members of the Working Group and reflects our efforts to clearly communicate statistics about the racial and ethnic diversity of the U.S. population.
Page Last Revised - May 31, 2023
✕
Is this page helpful?
 Yes
Yes
 No
No
 Yes
Yes
 No
No✕
NO THANKS
255 characters maximum
 255 characters maximum reached
✕
Thank you for your feedback.
Comments or suggestions?

Comments or suggestions?