Underlying Dynamics of Changes in Health Insurance Coverage
Underlying Dynamics of Changes in Health Insurance Coverage
Age matters when determining whether people have health insurance, as well as what kind they have. Age also matters when considering differences between subpopulations; some groups may be, on average, older or younger than others. Does age mask underlying changes in health insurance coverage rates for subpopulations over time?
Over the last several years, coverage rates increased for people under age 65 (most notably for Direct Purchase and Medicaid coverage), and in particular for young adults. Coverage rates also increased for many subpopulations, including race and Hispanic origins groups.
Overall, non-Hispanic whites were more likely to have health insurance coverage than any other racial group (Figure 1), in part due to the large number of people 65 years and older and nearly universal coverage of this age group through Medicare. However, differences in coverage rates by race and Hispanic origin narrowed beginning in 2014. The percentage of people with some kind of insurance went up for all groups but rose faster for Hispanics, whose average rates had been lowest. Direct-purchase, Medicaid, and Medicare coverage increased for blacks, Hispanics, Asians, and non-Hispanic whites. Employment-based coverage increased for all groups except non-Hispanic whites, whose coverage rates remained relatively constant. However, this steady figure hides a more nuanced story, once again related to age.
Source: U. S. Census Bureau, American Community Surveys, 2009 to 2016. For more information, see www.census.gov/programs-surveys/acs/.
The age structure of the white, black, Asian, and Hispanic populations have markedly different age patterns and median ages (Figure 2). The non-Hispanic white population is oldest (median age 42), followed by Asian (median age 35), black (median age 32), and Hispanic (median age 27). Taking advantage of the large sample size provided by the American Community Survey, we can account for age differences among race and Hispanic origin groups by looking within age groupings that are relevant to health insurance types.
For employment-based health insurance coverage (Figure 3), among 19- to 25-year-olds, all groups – non-Hispanic whites, blacks, Asians and Hispanics – saw steep increases in their coverage since 2010. However, among non-Hispanic whites, these increases were offset by falling employment-based coverage rates for older age groups, resulting in little movement of this insurance type in the non-Hispanic white population overall.
Source: U. S. Census Bureau, American Community Surveys, 2009 to 2016. For more information, see www.census.gov/programs-surveys/acs/.
For direct-purchase health insurance coverage (Figure 4), two notable differences stand out among the age groups. For the entire period, the rate of direct-purchase insurance among 19- to 25-year-olds was higher for Asians and increased more than for the non-Hispanic white population. At the same time, among the 65 and older population, non-Hispanic whites had higher rates compared with the other race groups, even as their rates declined over the entire period.
Source: U. S. Census Bureau, American Community Surveys, 2009 to 2016. For more information, see www.census.gov/programs-surveys/acs/.
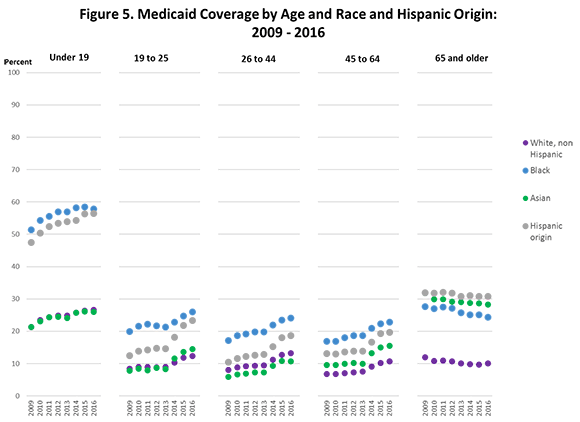
For Medicaid (Figure 5), all race and Hispanic groups for all ages younger than 65 saw increasing coverage from 2009 to 2016. Among 19- to 25-year-olds, Hispanics had the greatest increase in coverage over the entire period, and in 2014, Hispanics and Asians had greater increases in coverage than other groups.
Source: U. S. Census Bureau, American Community Surveys, 2009 to 2016. For more information, see www.census.gov/programs-surveys/acs/.
For Medicare (Figure 6), which did not change its coverage rules during the period, coverage rates between 2009 and 2016 for race and Hispanic groups changed little within each age group.
Source: U. S. Census Bureau, American Community Surveys, 2009 to 2016. For more information, see www.census.gov/programs-surveys/acs/.
These figures illustrate the complexity of recent changes in health insurance in the United States, some of which can be explained by differences within subpopulations. For more information on health insurance, see www.census.gov/topics/health/health-insurance.html.


