Demand for Child Care and the Distribution of Child Care Facilities in the United States: 1987 - 2007
Demand for Child Care and the Distribution of Child Care Facilities in the United States: 1987 - 2007
Increases in the number of working women, changes in family structure, and the desire to provide young children with educational opportunities have all driven up the demand for child care provided outside of the home. The Economic Census provides a unique opportunity to examine the distribution of child care facilities across the United States. Understanding the geographic distribution of child care facilities can help researchers, policy makers, planners, and educators determine where child care needs are not being met.
The Economic Census collects information every 5 years on American businesses. Data on child care facilities includes three main types of facilities: 1) non-employer businesses (e.g. a family daycare home), 2) establishments with an employee payroll that pay income taxes (e.g. a child care center for profit), and 3) establishments with an employee payroll that are tax-exempt (e.g. a non-profit based child care center). The maps and tables shown below at the state level data are available for 1987, 1992, 1997, 2002, and 2007 (the most recent year for which data is available). County level tables and maps are available for 1997, 2002, and 2007. Detailed data on child care facilities can be found under statistics for Health Care and Social Assistance (NACIS code 6244).
State variations in Child Care Establishments, 1987 – 2007

Child care options outside of the home have expanded greatly over the last several decades. In 2007, there were 766,401 child care facilities in the United States, up from 262,511 facilities in 1987. Nine in ten child care businesses are non-employer child care businesses, such as a family day care home. Family day care facilities often require less financial investment than large for-profit child care centers and family day care owners can readily enter and exit the market as needed.
Like most service sectors, child care primarily serves local demand. One way to measure demand and compare the availability of child care facilities across geographic areas is to look at the number of facilities per 1,000 children under age five. This approach provides a standardized way to examine the distribution of child care facilities across areas with very different age distributions and population densities. Overall, the ratio of child care establishments per 1,000 children under five years more than doubled from 15 per 1,000 in 1987 to 37 per 1,000 in 1997. Most of this increase occurred among non-employer businesses, which rose from 12 per 1,000 in 1987 to 33 per 1,000 in 2007.
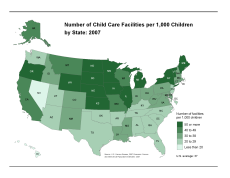
Data from the Economic Census indicate that the highest ratios of child care establishments per 1,000 children under five years of age are in the Central states. North Dakota had the highest establishment ratio for all five Census years - 1987, 1992, 1997, 2002, and 2007. In 2007 the ratio of child care establishments in North Dakota was 80 per 1,000 children under five years of age.
In general, child care establishments seem less available to families in the South, but also in some Western states, especially Nevada (17 per 1,000), Arizona (22 per 1,000, and Utah (23 per 1,000).
2007 State Level Map
2002 State Level Map
1997 State Level Map
1992 State Level Map
1987 State Level Map
County level variations in Child Care Establishments, 1997 – 2007
Selecting a child care arrangement can be a balancing act for many parents as they work to fulfill their responsibilities to both their children and their employers. Parents often make decisions based on the accessibility, affordability, and quality of a child care provider. The inherent complexity of the child care market has led to an uneven distribution of services, leaving some communities well-supplied while others have unmet needs.
Data from the 1997, 2002, and 2007 Economic Census at the county level highlight the uneven distribution of child care establishments across counties in the United States. To measure demand at the county level, the ratio of facilities per 100 children under age five is used to examine the distribution of child care facilities across counties of varying geographic size and population densities. The ratio of child care establishments per 100 children under five years across all counties was 3 per 100 in 1997 and increased slightly to 4 per 100 in 2007. Bronx county in New York state had the highest ratio of child care establishments in 2007, with 18 facilities per 100 children under five years of age.
While state level data indicate that states in the Midwest generally had more child care facilities per 1,000 children under five years of age than states in the South, county level data show that many counties in the Midwest contained few young children. Child care facilities in the Midwest tended to be located in counties that contain or are near large urban areas (Bismarck or Fargo, ND or Des Moines, Iowa).
Between 1997 and 2007, counties across Southern states saw a general increase in the ratio of child care facilities per 100 children under five years of age. Growth was concentrated in counties along the Gulf Coast in Louisiana (St. Mary Parish and St. Martin), the Mississippi Delta region, and South Central Alabama.
2007 County Level Map
2002 County Level Map
1997 County Level Map
Disclaimer: This report is released to inform interested parties of ongoing research and to encourage discussion of work progress. The views expressed are those of the authors and not necessarily of the U.S. Census Bureau.


