Is Your State in Step with National Marriage and Divorce Trends?
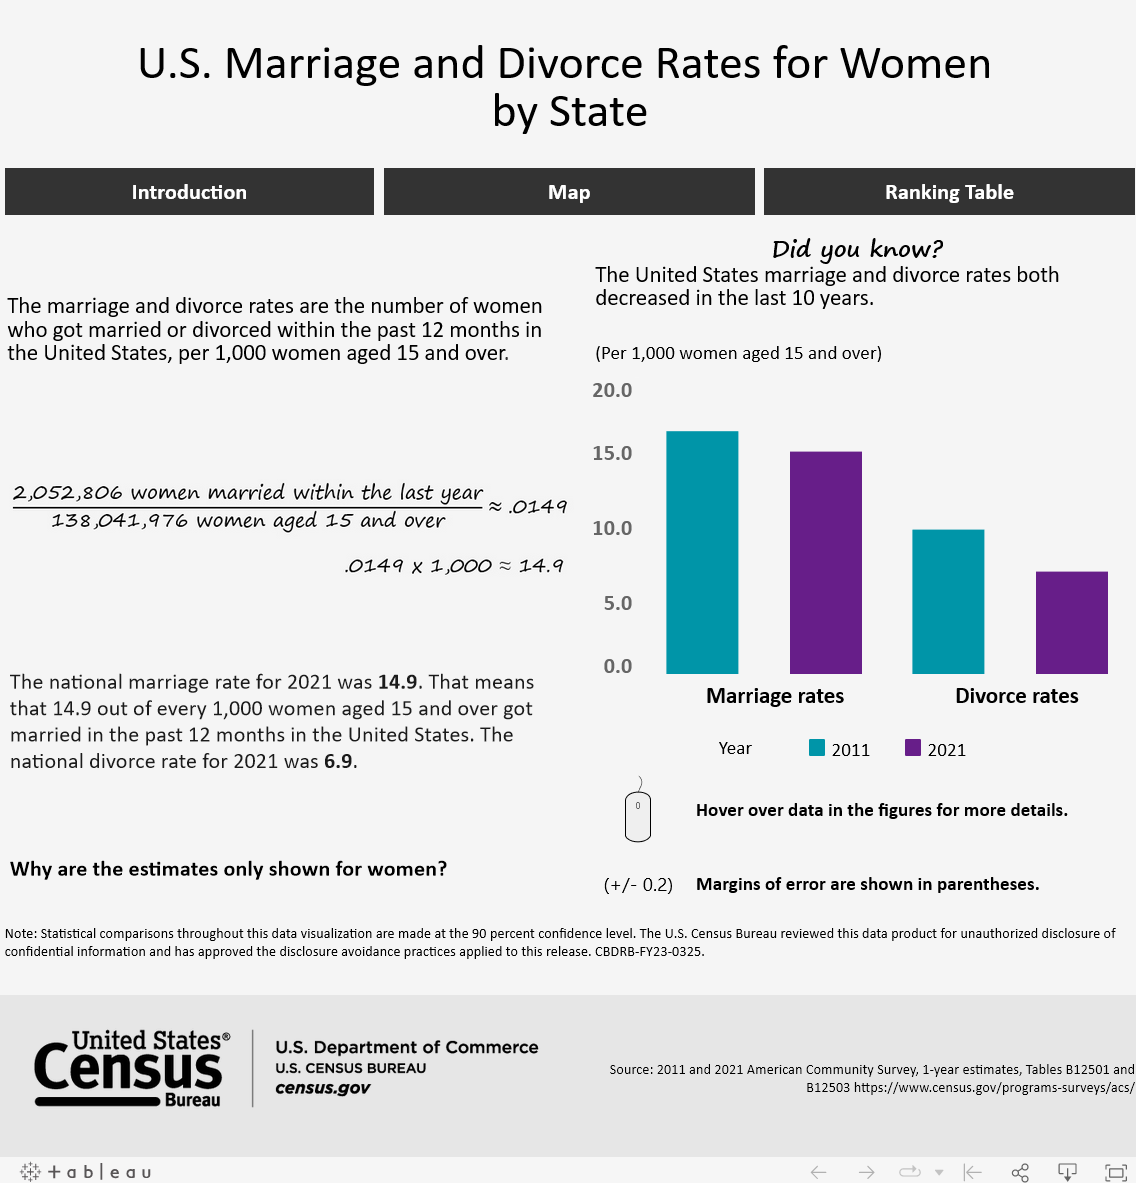
Both the marriage and divorce rates of U.S. women age 15 and older declined from 2011 to 2021.
In 2021, the U.S. marriage rate was 14.9 marriages in the last year per 1,000 women, down from 16.3 a decade earlier. And the 2021 divorce rate dropped to 6.9 in the last year from 9.7 divorces per 1,000 women in 2011.
But the rates varied by state during both time periods.
Alaska and Utah had among the highest marriage rates, at 23.5 and 22.3, respectively.
Now, an updated U.S. Census Bureau visualization allows you to rank and compare divorce and marriage rates in your state to those in other states and the nation.
Using data from the 2011 and 2021 American Community Survey 1-year estimates, it provides a state-by-state look at marriage and divorce rates per 1,000 women age 15 and older. Please note that not all differences in state marriage and divorce rates are statistically significant.
While the U.S. Census Bureau publishes estimates for both men and women, we have restricted this visualization to data for women to provide a digestible look at trends in marriage and divorce. Historically, women’s data have often been presented when a choice needs to be made. Previous research [PDF 2.3 MB] found that women more often report data for themselves and report their marital history more accurately.
According to the data, in 2021:
- Alaska and Utah had among the highest marriage rates, at 23.5 and 22.3, respectively. These rates, however, do not significantly differ from each other.
- Puerto Rico had among the lowest marriage and divorce rates. Its marriage rate was 4.7 and its divorce rate 3.9. Puerto Rico’s low marriage and divorce rates likely resulted, at least in part from the high outmigration of its young adult population, especially after Hurricane Maria.
- Massachusetts had a marriage rate of 11.8, also among the nation’s lowest.
- Idaho and Arkansas had among the highest divorce rates, at 11.1 and 11.0, respectively (not a statistically significant difference).
- New Hampshire had a divorce rate of 4.3, among the lowest in the nation.
There are three components of the visualization: an introductory tab discussing how marriage and divorce rates are calculated; a map tab showing each state’s marriage and divorce rates compared to the national average; and a ranking table tab showing each state’s marriage/divorce rank in 2011 and 2021.
Note: Select the image to go to the interactive data visualization.
Related Statistics
Stats for Stories
Subscribe
Our email newsletter is sent out on the day we publish a story. Get an alert directly in your inbox to read, share and blog about our newest stories.
Contact our Public Information Office for media inquiries or interviews.


