U.S. Older Population Grew From 2010 to 2020 at Fastest Rate Since 1880 to 1890
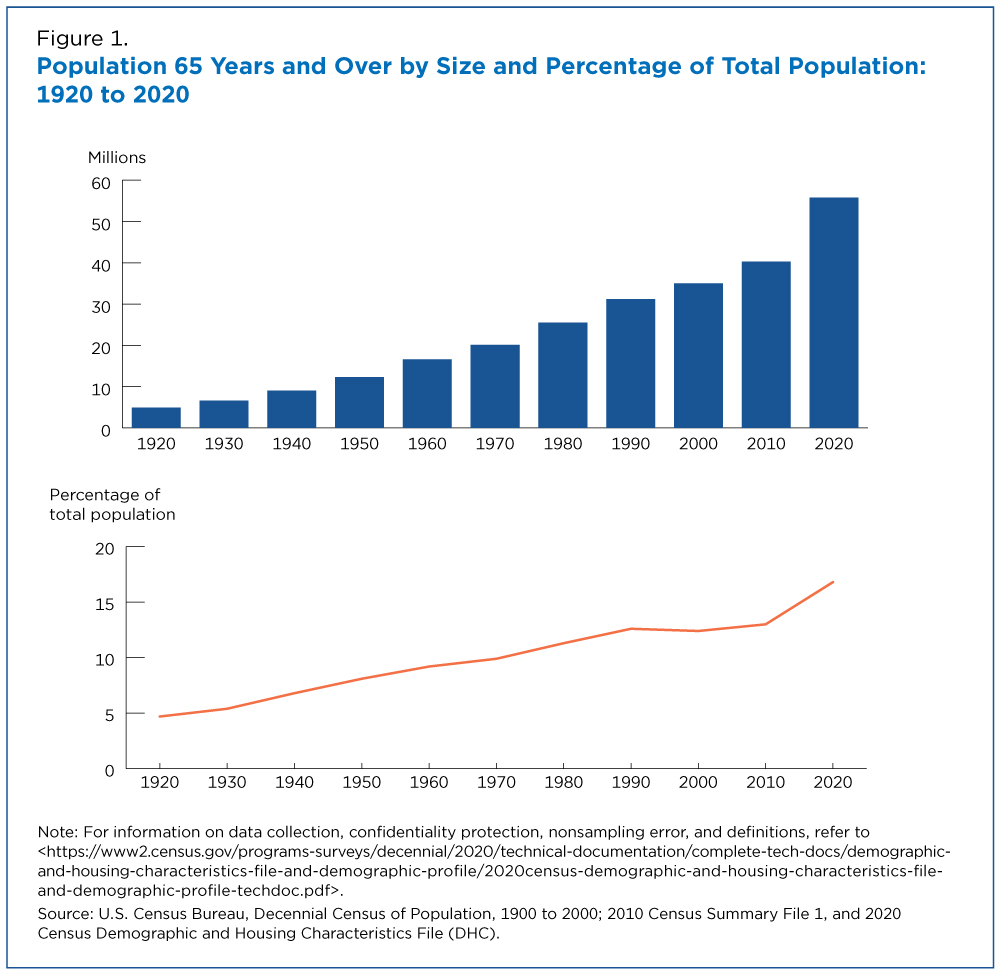
The U.S. population age 65 and over grew nearly five times faster than the total population over the 100 years from 1920 to 2020, according to the 2020 Census.
The older population reached 55.8 million or 16.8% of the population of the United States in 2020.
Figure 1 shows the number and percentage of people age 65 and over in decennial censuses since 1920.
In 2020, about 1 in 6 people in the United States were age 65 and over. In 1920, this proportion was less than 1 in 20.
The older population increased by 50.9 million, from 4.9 million (or 4.7% of the total U.S. population) in 1920 to 55.8 million (16.8%) in 2020. This represents a growth rate of about 1,000%, almost five times that of the total population (about 200%).
In 2020, about 1 in 6 people in the United States were age 65 and over. In 1920, this proportion was less than 1 in 20.
Growth in Older Population Spiked 2010-2020
The older population has been growing for the past 100 years but the decade before 2020 saw its fastest increase since 1880 to 1890. From 2010 to 2020, the 65-plus population experienced its:
- Largest-ever 10-year numeric gain — an increase of 15.5 million people. The next largest 10-year numeric increase, 5.7 million between 1980 and 1990, was less than half that size.
- Largest-ever percentage-point increase, from 13.0% to 16.8% of the total population. Before 2010, it took 50 years — from 1960 to 2010 — for the older population’s share of the total population to grow by the same number of percentage points.
- Fastest growth rate, 38.6% from 40.3 million to 55.8 million. This was the fastest growth rate of any decade since 1880 to 1890 (40.3%) and more than twice as fast as the previous decade (15.1% from 2000 to 2010). The older population also grew five times faster than the total population, which grew by 7.4%.
The Baby Boomers Factor
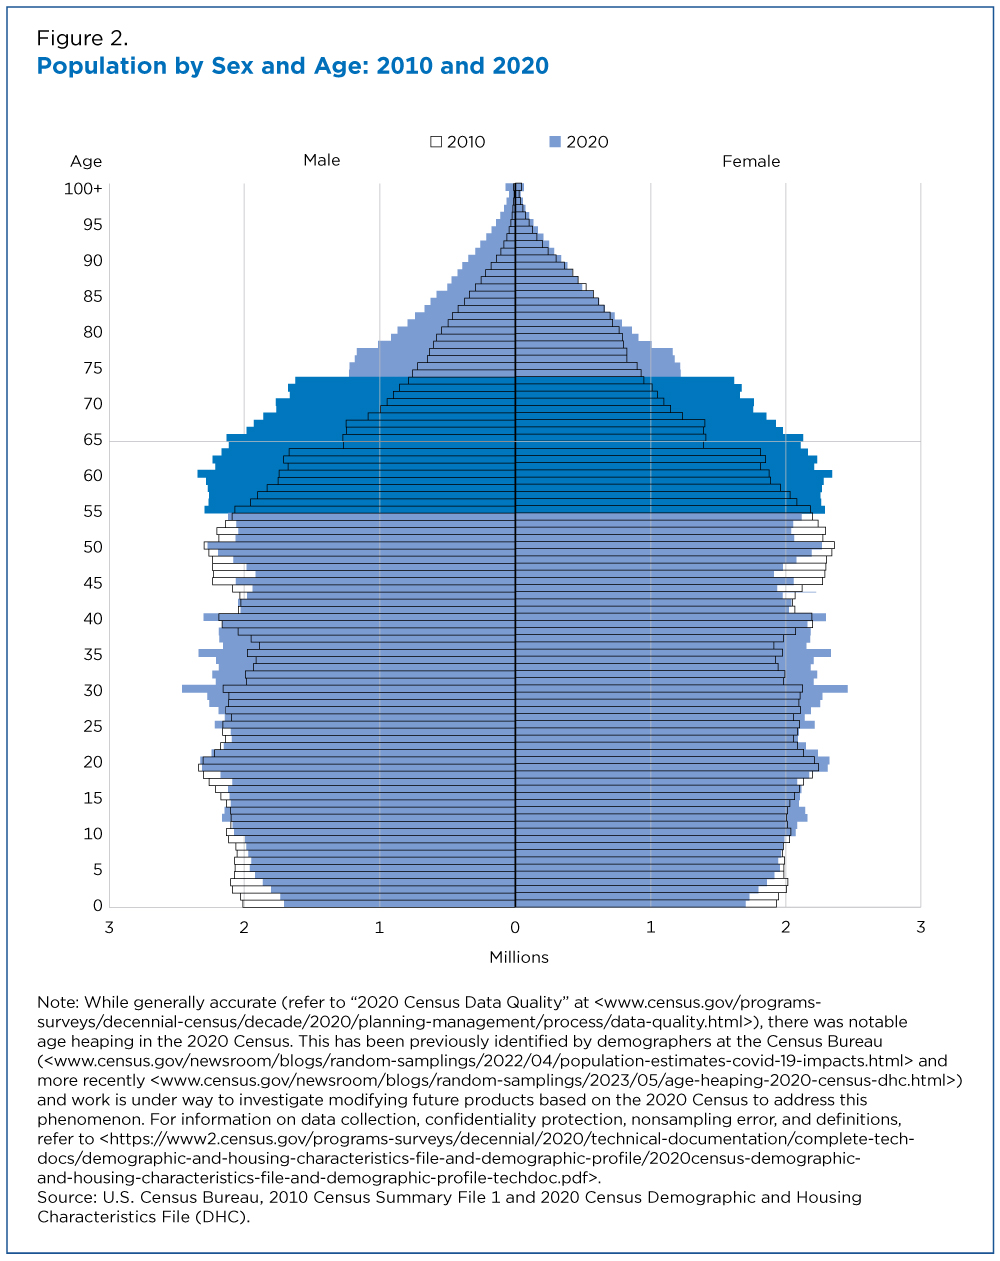
The rapid growth was largely driven by aging baby boomers (born between 1946 and 1964) who began turning 65 in 2011.
Superimposed 2010 and 2020 age-sex pyramids show how the aging of the baby boomer generation affected the age distribution of the United States (Figure 2).
In 2010, the baby boom population appears as a bulge in the middle of the pyramid at ages 46 to 64. In 2020, the bulge is higher, when boomers were ages 56 to 74 and nearly half were over 64.
By 2030, all baby boomers will be age 65 and over and the growth in the older population is projected to start slowing.
Growth Varies by Age Groups
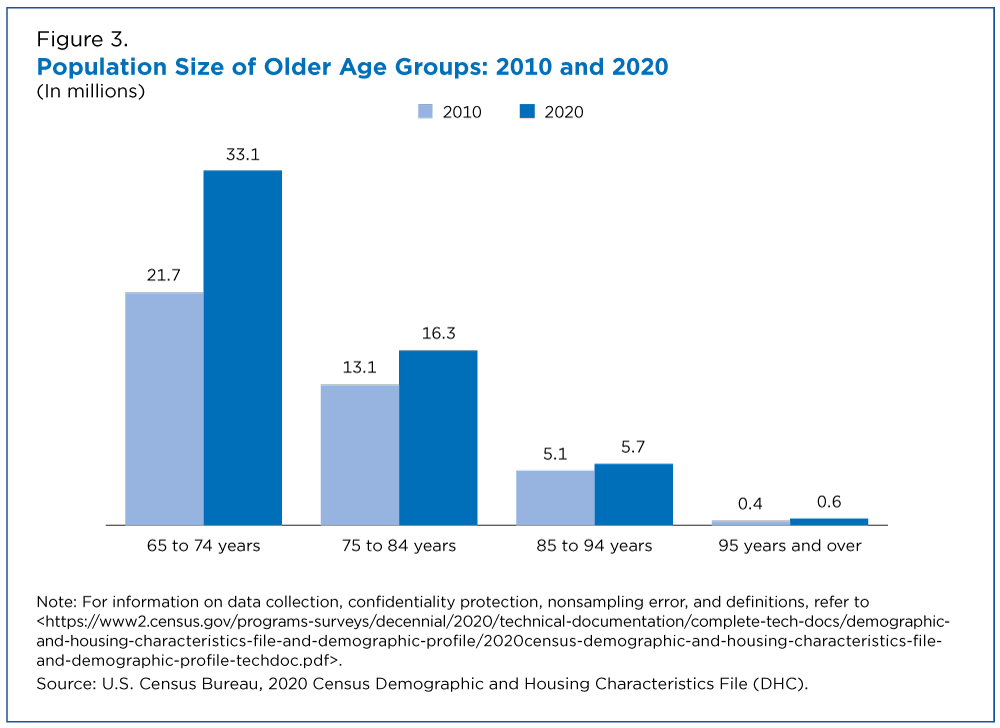
While the older population grew from 2010 to 2020, the size and rate varied for older age groups (Figure 3).
In 2020, the 65-74 age group:
- Was the largest of the older age groups with 33.1 million people, representing over half of the 65-and-over population.
- Represented 1 in 10 Americans in 2020.
- Experienced the largest growth of any older age group the previous decade. Its numbers grew by 11.4 million or 52.5%, increasing from 21.7 million in 2010 to 33.1 million in 2020.
Other findings:
- The 75-to-84 age group grew at about half that rate (25.1%) but is expected to pick up the pace in the next decade as baby boomers age into this group.
- The 85-to-94 age group experienced relatively slower growth (12.6%) than other older age groups, increasing from 5.1 million to 5.7 million.
- The population 95 years and over also experienced a large growth rate (48.6%), increasing from about 425,000 in 2010 to 631,000 in 2020.
United States is Getting Older, But Still Younger Than Many
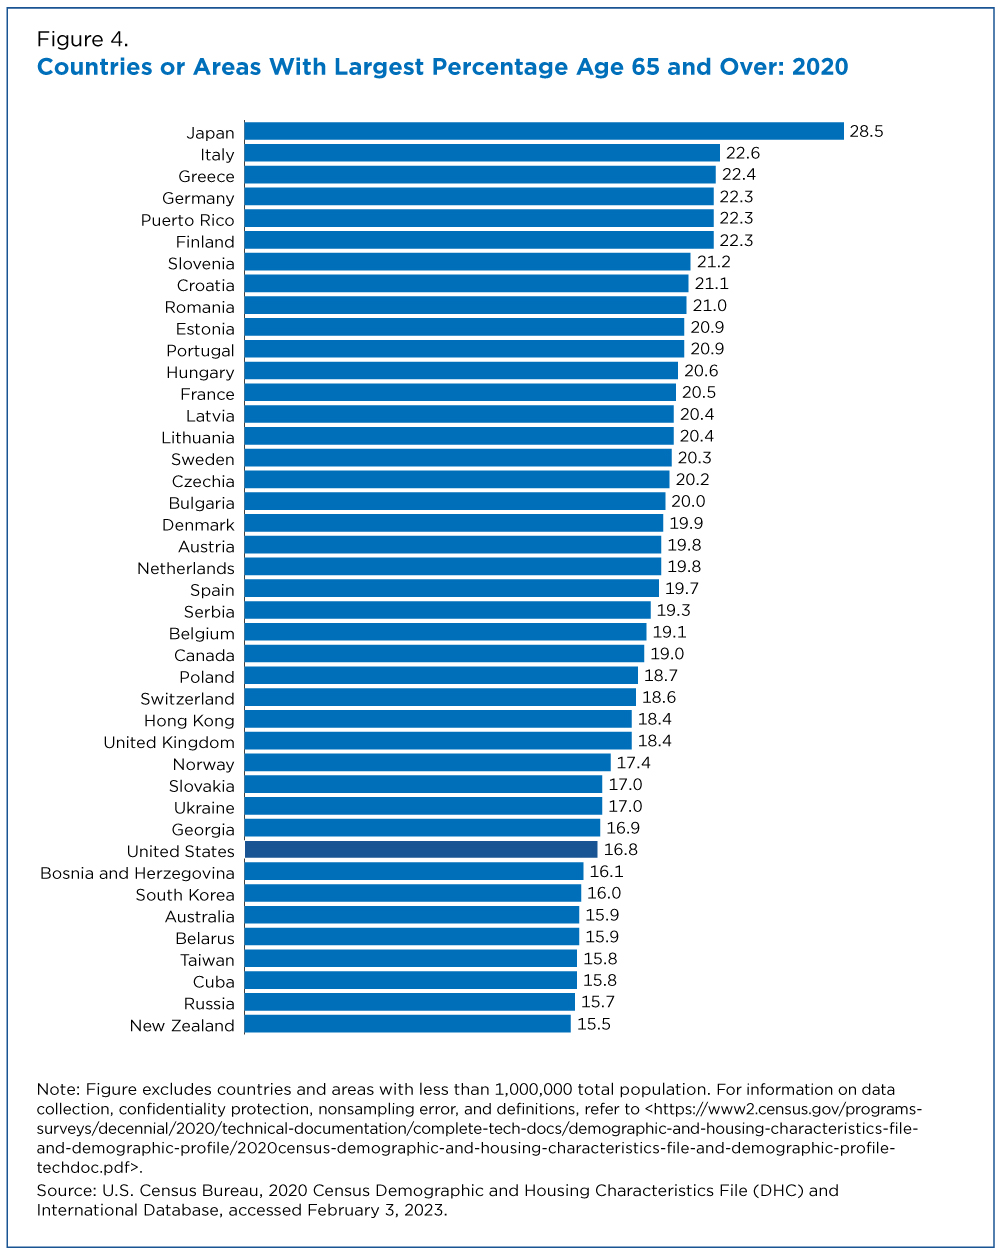
While the share of the U.S. population age 65 and over grew, the nation remained relatively young compared to many of its peer nations in 2020 (Figure 4).
Japan had the largest share (28.5%) of older residents. The United States ranked 34th (16.8%) among these places. Many European countries, along with Canada and Hong Kong, had higher shares of older residents than the United States.
Among countries with at least 15% of their population age 65 and over, New Zealand, Russia and Cuba had the smallest proportions of older residents.
The Older Population: 2020 provides more information about the nation’s 65-plus population.
Use the interactive data visualizations to explore data for the older population at lower levels of geography.
Data Visualizations
Additional Resource
View this short Data Gem video to learn how to use the interactive data visualizations to access more information about the growth of the older population.
Subscribe
Our email newsletter is sent out on the day we publish a story. Get an alert directly in your inbox to read, share and blog about our newest stories.
Contact our Public Information Office for media inquiries or interviews.


