Vaccinated Adults Report Symptoms of Anxiety or Depression Less Frequently Than the Unvaccinated
More U.S. adults are now reporting symptoms of anxiety or depressive disorder than before the pandemic, according to a comparison of recent data from the U.S. Census Bureau’s experimental Household Pulse Survey (HPS) and data from the National Center for Health Statistics (NCHS) from 2019.
Even so, the data also show that the share of adults reporting these symptoms is lower now than it was a year ago. However, frontline workers working outside the home are more likely to be experiencing these symptoms than all other workers.
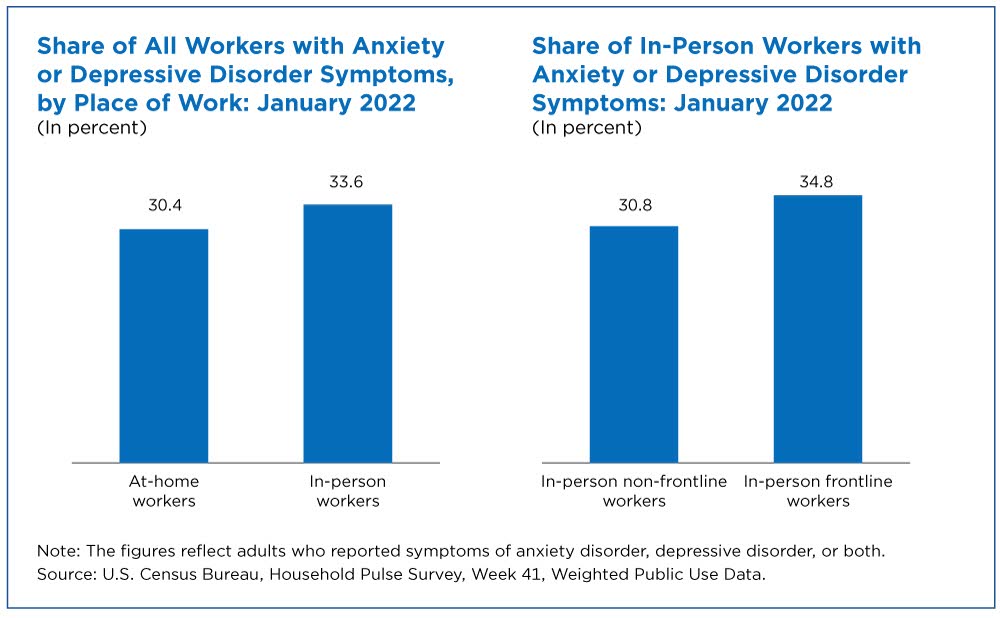
HPS data show that in January of 2022, individuals who worked at home were less likely to report symptoms of anxiety or depressive disorder than those who worked in-person in the last week, 30% vs 34%, respectively.
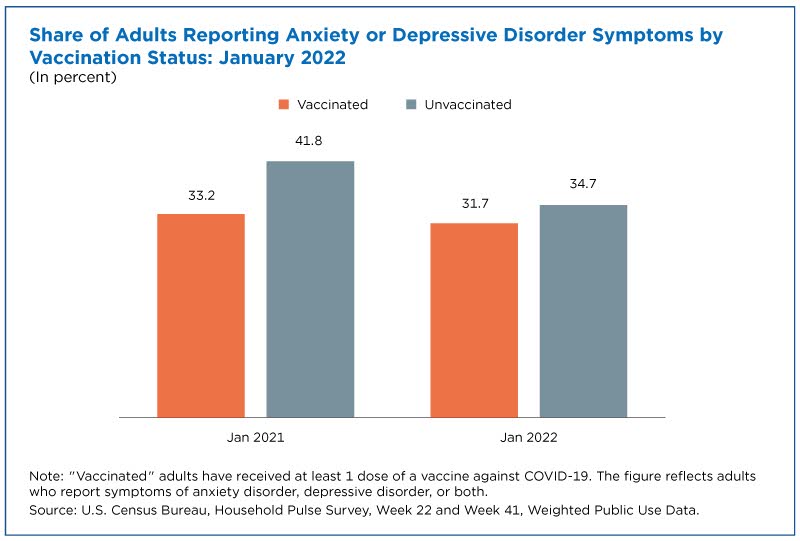
The most recent data show that unvaccinated adults in surveyed househods reported experiencing these symptoms at a higher rate than adults who are vaccinated.
Concern Over Mental Health
Over the course of the COVID-19 pandemic, there has been concern that hardships associated with the pandemic could exacerbate mental health problems in the United States.
A recent U.S. Government Accountability Office (GAO) report stated that the “… effects of the COVID-19 pandemic and related economic crisis — such as increased social isolation, stress, and unemployment — have intensified concerns about the number of people in the U.S. affected by …mental health …disorders.”
In order to provide measures of self-reported mental health symptoms, the HPS includes questions about anxiety and depression developed with the National Center for Health Statistics (NCHS) at the Centers for Disease Control (CDC).
Two questions asked respondents if they had experienced symptoms of anxiety recently and if so, how often.
The questions offered the following choices that carry a certain value: not at all (0), several days (1), more than half the days (2), and nearly every day (3).
If a respondent’s answers to the two anxiety questions totaled “3” or higher, they were categorized as reporting symptoms of anxiety disorder. The same methodology was applied to two questions about depression to determine symptoms of depressive disorder.
These categories are in line with benchmarks developed by the NCHS for 2019. In HPS data collected in January 2021, respondents were asked if they’d experienced these symptoms “during the last 7 days”. In HPS data collected after August 2021, the period was expanded to “during the last 2 weeks”.
Reported Symptoms of Anxiety and Depression During the Pandemic
HPS data show that reports of symptoms of anxiety and depression are higher during the pandemic than they were pre-pandemic but that reports of these symptoms have declined over the past year.
Data from the HPS collected in January of 2021 showed that 41% of adults reported experiencing symptoms of anxiety and/or depressive disorder at that time.
That was higher than the NCHS data that showed 11% of adults reported experiencing these symptoms in 2019.
The most recent HPS data, however, showed a significant decline in the prevalence of reports of these symptoms from a year ago: In the first half of January 2022, 32% of all adults reported experiencing symptoms of anxiety and/or depression in the previous two weeks.
Where You Work Makes a Difference
HPS data show that in January of 2022, individuals who worked at home were less likely to report symptoms of anxiety or depressive disorder than those who worked in-person in the last week, 30% vs 34%, respectively.
The survey also shows that among in-person workers, there was a difference in the likelihood of reporting these symptoms.
The HPS identifies 17 in-person job settings that are often considered “frontline” workplaces in terms of risk of COVID-19. These include medical settings, first responders, K-12 schools, food manufacturing, and food retail, among others.
“Frontline” workers were more likely to report symptoms of anxiety or depressive disorders. For in-person workers in one of these frontline workplaces, about 35% reported symptoms of anxiety or depressive disorder, but for all other in-person workers, the share that reported these symptoms was about 31%.
In fact, in-person workers in non-frontline jobs were no more likely to report symptoms than people who worked at home.
Vaccination Status Also Matters
Increased vaccination may help explain why anxiety and depression have declined over time.
In January of 2021, 33% of vaccinated adults were experiencing symptoms of anxiety or depression but 42% of unvaccinated adults experienced those symptoms. However, a very small share of adults had been vaccinated at that time.
The CDC’s COVID data tracker shows that on January 10, 2021, just over 10 million adults in the United States had received at least one shot.
Over the course of 2021, COVID-19 vaccines became more available. By January 20, 2022, the CDC tracker shows that 225 million adults had received at least one dose of a vaccine against COVID-19.
The share of adults reporting symptoms of anxiety or depression in January continued to be lower for adults who had received at least one shot than for unvaccinated adults.
While the share of vaccinated adults reporting these symptoms remained constant year to year, the share of the unvaccinated reporting anxiety or depression declined.
That could be because the vaccinated and unvaccinated populations have changed. In 2021, the unvaccinated included people who wanted the vaccine but could not get it.
In January 2021, the HPS data show that there were 173 million unvaccinated adults who said they would get a vaccine when available. By January 2022, only 37 million remained unvaccinated and 24 million of them reported they probably or definitely would not get a vaccine.
"Vaccinated" here refers to adults who have received at least one dose of any COVID vaccine, and "unvaccinated" refers to adults who have not received any.
About the Household Pulse Survey
The HPS is designed to provide near real-time data on how the pandemic is affecting Americans’ lives. Information on the methodology and reliability of these estimates can be found in the source and accuracy statements for each data release.
Data users interested in state-level sample sizes, the number of respondents, weighted response rates and occupied housing unit coverage ratios can consult the quality measures file available at the same location.
The latest data analyzed for this story were collected from December 29, 2021-January 10, 2022, during week 41 of the survey. The Census Bureau sent invitations to 1,044,701 households and received a total of 74,995 responses, for a weighted response rate of 7.2%.
Data collected from January 6-18, 2021, during week 22, are also referenced. In that data cycle, the Census Bureau sent invitations to 1,037,972 households, and received a total of 68,348 responses, yielding a weighted response rate of 6.4%.
Daniel J. Perez-Lopez is a survey statistician in the Social, Economic and Housing Statistics Division.
Subscribe
Our email newsletter is sent out on the day we publish a story. Get an alert directly in your inbox to read, share and blog about our newest stories.
Contact our Public Information Office for media inquiries or interviews.


