Women Consistently Earn Less Than Men
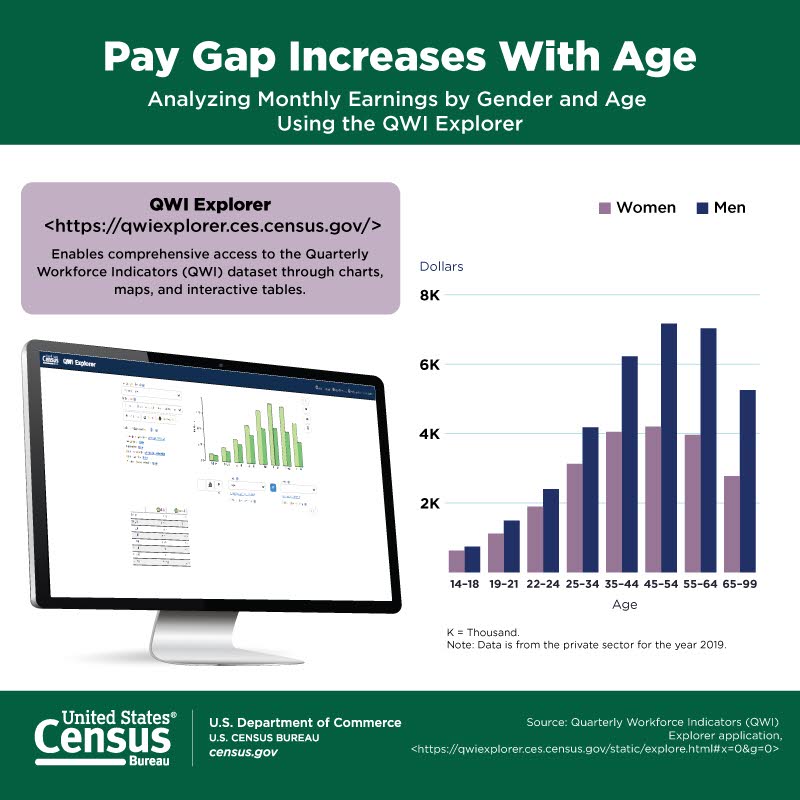
Women are over-represented in lower paying jobs and, as they age, the pay gap widens even more.
The U.S. Census Bureau’s Quarterly Workforce Indicators (QWI) shows the pay and age dynamic of women and men. Here, we looked at workers ages 35-44.
According to the QWI data based on unemployment insurance wage records for the third quarter of 2020 (the most recent national data), women in the United States earned 30% less than men and that pay gap increased with age.
The gender gap has narrowed for younger women as they increase their education level and break into occupations traditionally dominated by men.
Although the gender pay gap has narrowed since the signing of the Equal Pay Act of 1963, women earned 82 cents for every dollar a man earns according to 2020 data from the Bureau of Labor Statistics.
The gender gap has narrowed for younger women as they increase their education level and break into occupations traditionally dominated by men.
While women have a growing presence in higher paying industries like Information or Professional, Scientific, and Technical Services, they are still over-represented in lower paying industries.
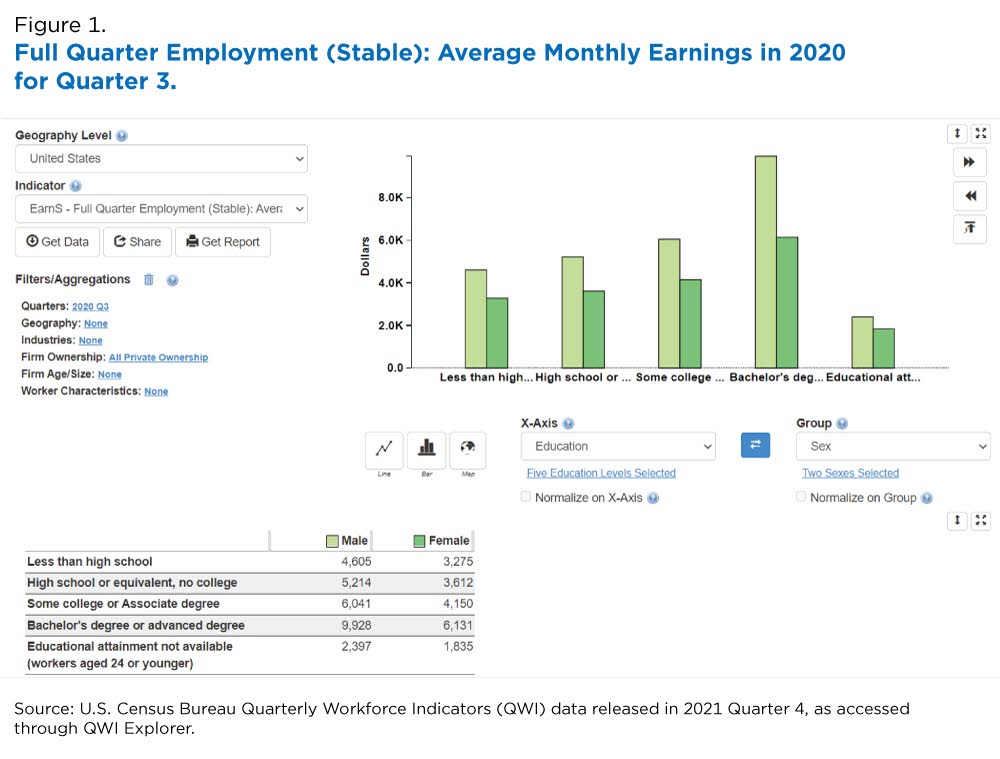
QWI Explorer provides easy access to national data on earnings of women and men. Figure 1 shows a gap in monthly wages of almost $4,000 for women compared to men with a bachelor’s or advanced degree.
Women are more likely than men to be employed in professional and related occupations, according to a 2019 BLS report. Within the professional category, however, the proportion of women in higher paying jobs is much smaller than that of men.
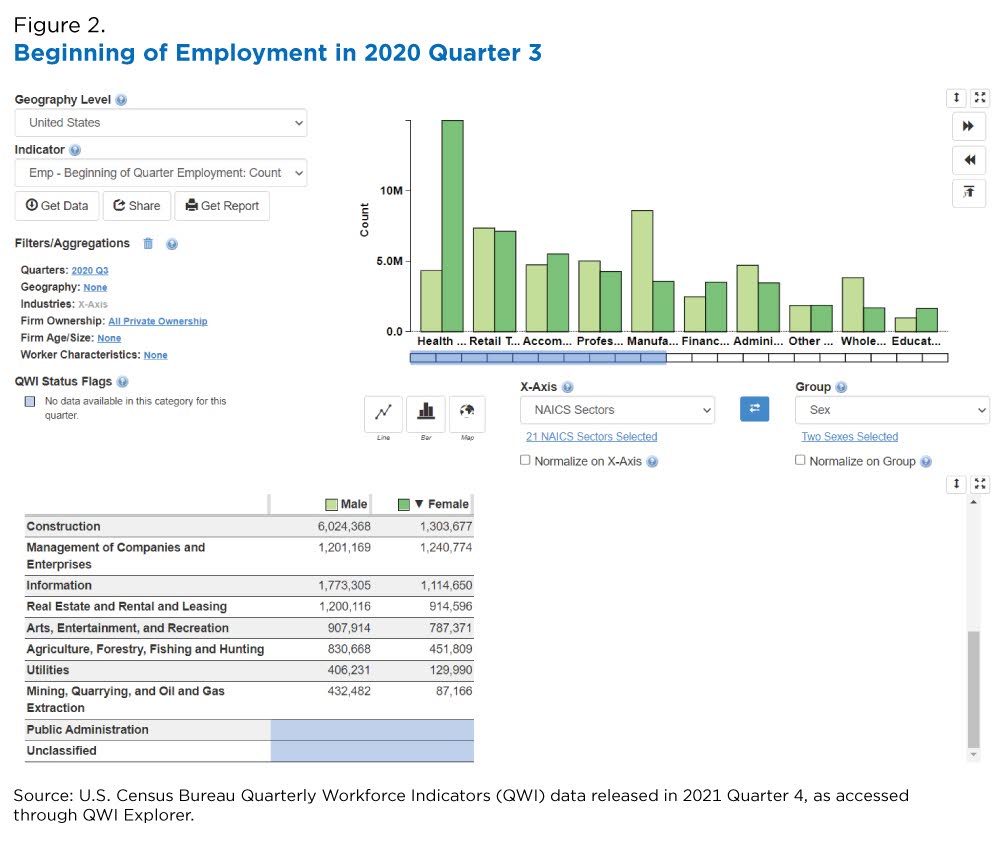
Figure 2 shows there are nearly 15 million women in Health Care and Social Services, over 7 million in Retail and Trade and 5.5 million in Accommodations and Food Services.
QWI Explorer
The QWI Explorer allows users to examine different aspects of the labor market through interactive tables that compare and rank labor force statistics on:
- Employment.
- Job creation and destruction.
- Wages.
- Hires and separations.
Through interactive visualizations and detailed reports, users can analyze earnings by worker sex, race, education, industry, and age across national, state, metro/micropolitan, and workforce investment areas.
An infographic published last year using 2019 data from the Longitudinal Employer-Household Dynamics (LEHD)’s Quarterly Workforce Indicators (QWI) Explorer illustrates the trend.
Subscribe
Our email newsletter is sent out on the day we publish a story. Get an alert directly in your inbox to read, share and blog about our newest stories.
Contact our Public Information Office for media inquiries or interviews.


