Despite Our Love of All Things Electronic, Bookstores Still Relevant This Holiday Season
Looking for the perfect gift for your hard-to-please family member or friend who returns every gift you give them?
Out of ideas?
Your local bookstore may be just the place to find gifts for those who seem to have everything and like nothing. How about a coffee table book with gorgeous photos of classic cars, national parks, or skyscrapers? Or a great novel that even the pickiest of people would enjoy curling up with on a sofa or beach lounge chair?
Despite all the advances in digital technology, bookstores still fill our need for knowledge and the written word and harken back to simpler times when we were not so tethered to our electronic devices.
Despite all the advances in digital technology, bookstores still fill our need for knowledge and the written word and harken back to simpler times when we were not so tethered to our electronic devices.
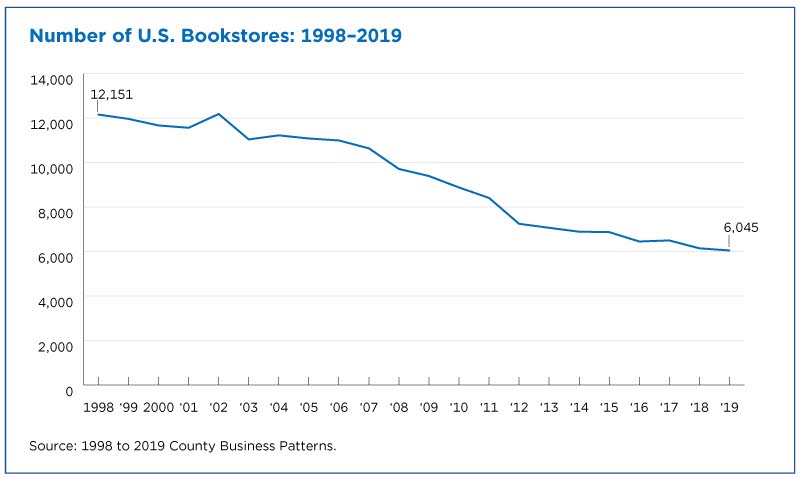
According to data from the Census Bureau’s County Business Patterns, while the number of U.S. Book stores (as listed in the North American Industry Classification System) dropped from 12,151 in 1998 to 6,045 in 2019, there were still more bookstores than some other types of retail businesses that are ubiquitous in our communities, including Home Centers (5,952 establishments) and Department Stores (3,856).
These employer (businesses with paid employees) bookstores had 61,068 workers and reported nearly $1.1 billion in annual payroll in 2019, averaging only $17,660 a year per employee. (FYI: This employment statistic was for the week of March 12 and therefore does not reflect any seasonal change in employment in this industry.)
Bookstores in Hawaii reported the highest average annual payroll per employee — $26,007.
Given it’s our most populated state, it’s no surprise there were more (605) bookstores in California and they employed the most (7,763) workers in this industry of any other state in 2019.
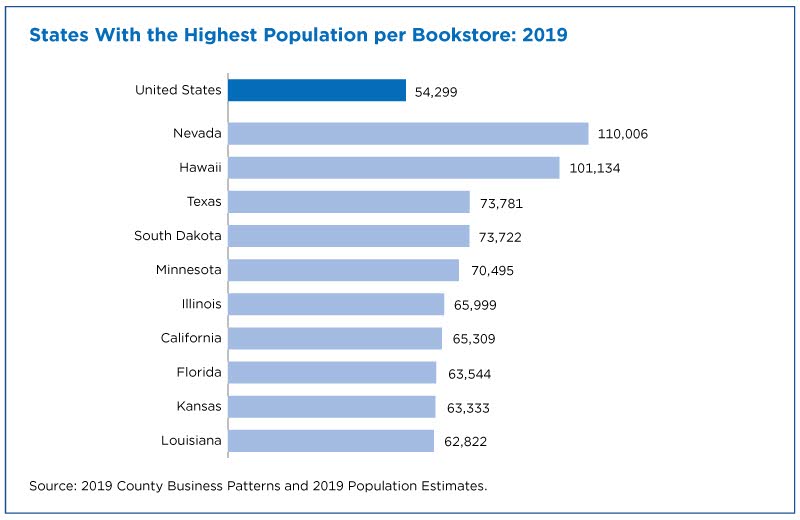
On average, there was one bookstore per 54,299 people in the United States in 2019. Nevada had the nation’s fewest number of bookstores per capita — one for every 110,006 state residents — perhaps making it an underserved market that could potentially support new bookstores.
Bookstore Sales
Despite the steady decline in the number of bookstores, bookstore sales increased from $12.4 billion in 1997, to $15.1 billion in 2002, and to $16.8 billion in 2007, according to the Economic Census which is conducted every five years. Bookstore sales then started dropping -- to $11.9 billion in 2012 and to $10.0 billion in 2017.
Retail sales of books made up 70.9% ($7.1 billion of the total $10.0 billion) of bookstores’ total sales in 2017. Among the other products bookstores sold:
- Office and school supplies and packaging materials ($412.3 million, 4.1%).
- Toys, games, and hobby supplies ($378.0 million, 3.8%).
- Meals and beverages ($305.7 million, 3.1%).
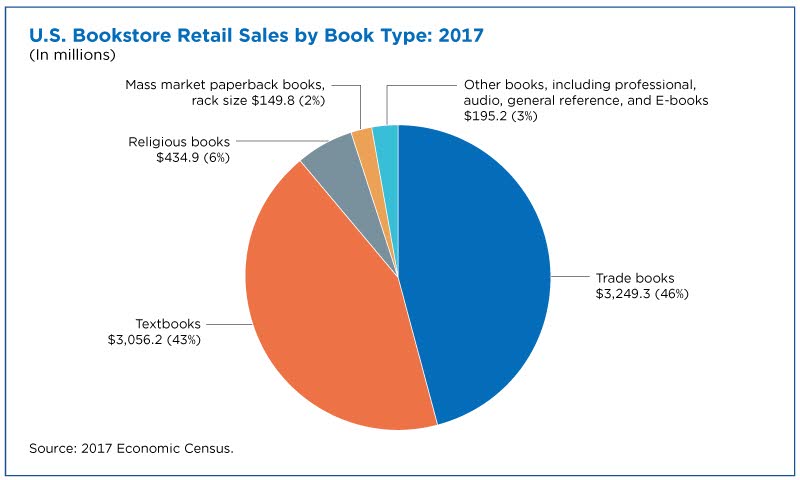
About 90% of bookstores’ total retail book sales in 2017 were for trade books and textbooks. The remaining 10% included religious books, mass market paperbacks, professional books, and others.
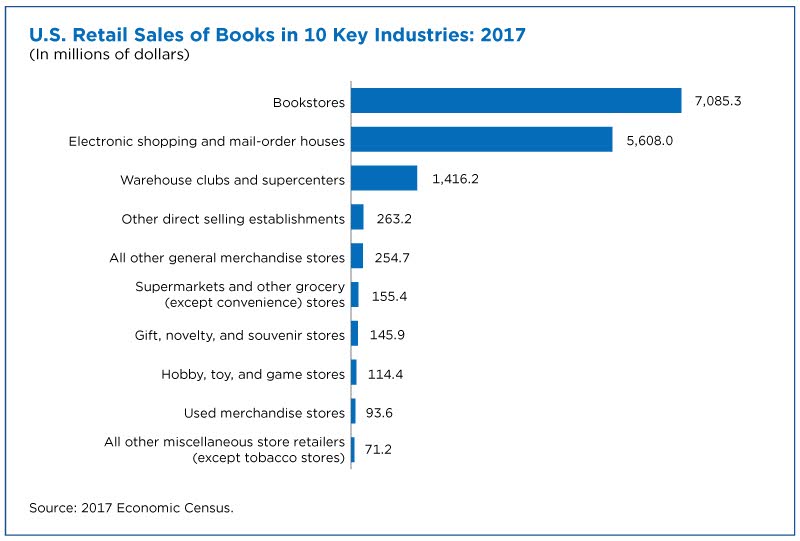
Clearly bookstores are the go-to for many book lovers. But they can also satisfy their thirst for reading at 50 or more other types of businesses, including Electronic Shopping and Mail Order Houses, Warehouse Clubs and Supercenters, and Other Direct Selling outlets. In fact, book sales ($8.3 billion) of businesses other than bookstores were similar to those made in bookstores in 2017.
Nonemployer Bookstores
In addition to the 6,143 employer bookstores, there were also 8,109 nonemployer bookstores in the United States in 2018, according to the Census Bureau’s Nonemployer Statistics program. (These small businesses include self-employed people who often report their business income on the Internal Revenue Service form 1040 Schedule C or SE.)
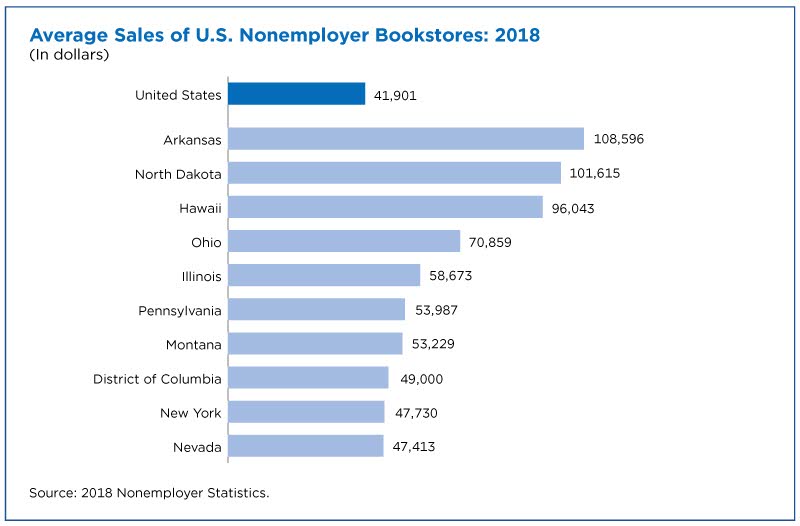
Nonemployer bookstores generated $339.8 million in sales in 2018, an average of $41,901 each. Nearly 30% (2,396) of these nonemployer bookstores earned less than $5,000 in total sales in 2018.
Arkansas reported the nation’s highest average annual sales –$108,596 –per nonemployer bookstore.
Bookstore Business Ownership Characteristics
The Census Bureau’s 2018 Annual Business Survey (ABS) provides data that classifies firms by the sex, ethnicity, race and veteran status of the business owner in 2017.
Almost all bookstore firms (90.9%) could be classified by sex, ethnicity, race, and veteran status in 2017. These firms made up 58.5% of the total sales of all establishments in this industry and 57.3% of the industry employment.
The ABS shows that in 2017:
- 88.8% had non-Hispanic owners.
- 84.5% had White owners.
- 82.3% were not owned by minorities.
- 81.2% were not owned by veterans.
The remaining 9.1% (that could not be classified by sex, ethnicity, race, and veteran status) accounted for 41.5% of the total sales of all firms in this industry and 42.7% of the industry’s employment.
More Recent Findings
According to the Annual Retail Trade Survey, bookstore sales decreased from $10.3 billion in 2017 to $9.8 billion in 2018 and to $9.1 billion in 2019 (the latest yearly data available at the time of publication).
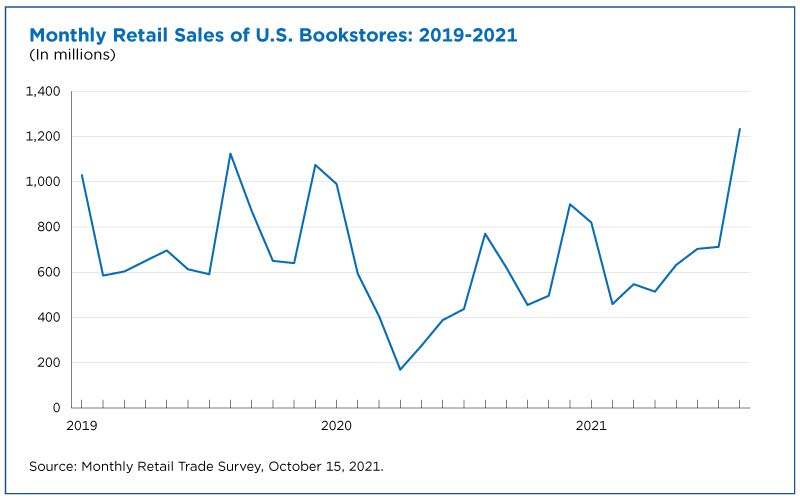
The monthly version of this survey, the Monthly Retail Trade Survey, provides additional insight into the industry’s seasonal nature. Bookstores typically experience increases in sales in August and December.
The Next Chapter for Bookstores
As we enter the holiday shopping season, the variety of businesses consumers can turn to for their gift of reading will continue to impact the future of bookstores in our communities.
Bookstores will likely continue to offer a wide variety of products and services (like in-store coffee shops) to draw consumers and encourage them to buy their core products.
Census Bureau data can help business owners identify potentially underserved communities and additional products they could sell so they can continue to contribute to local economies.
Note
The data in this story have undergone statistical testing and are significant at the 90-percent confidence level. Comparisons shown in the tables and graphics have not all been tested for statistical significance and, therefore, should be interpreted with caution.
Differences between estimates may be attributed to sampling or nonsampling error rather than to differences in underlying economic conditions. Caution should be used in drawing conclusions from the estimates and comparisons shown.
Monthly Retail Trade Survey (MRTS) estimates are not adjusted for seasonal variation, holidays, trading day differences or price changes. More information on MRTS confidentiality protection, sampling error, nonsampling error, sample design and definitions may be found on the MRTS methodology page.
Additional information on the Economic Census methodology, including sampling error and nonsampling error, may be found on the EC website.
Andrew W. Hait is a survey statistician/economist at the U.S. Census Bureau.
Story Ideas and Statistics
Stats for Stories
Stats for Stories


