
Official websites use .gov
A .gov website belongs to an official government organization in the United States.
Secure .gov websites use HTTPS
A lock (
) or https:// means you’ve safely connected to the .gov website. Share sensitive information only on official, secure websites.

Topics
Data & Maps
Surveys & Programs
Resource Library

19% of U.S. Households Could Not Afford to Pay for Medical Care Right Away
Nineteen percent of U.S. households could not afford to pay for medical care up front or when they received care in 2017, according to new U.S. Census Bureau data on the burden of medical debt.
The Survey of Income and Program Participation (SIPP) in 2018 added a new question about medical debt in the previous year. The survey asked whether respondents had “medical bills [they were] unable to pay in full.”
Households with children under age 18 (24.7%) were more likely than those without children (16.5%) to carry medical debt.
In August, the Census Bureau released detailed tables on debt for households in 2017, by type of debt and selected characteristics of households that owed money for medical services. The tables show that medical debt was distributed disproportionately across groups based on socioeconomic status, demographic characteristics, and the health status of household members.
This is the first time some of these stats are available. For example, a 2016 survey by the Kaiser Family Foundation includes questions about medical debt but lacks some of the additional information on individuals and households available in the SIPP. Other household surveys of total net worth do not specifically ask about the amount of medical debt.
What is medical debt?
The SIPP shows that in 2017, 19% of U.S. households carried medical debt, defined as medical costs people were unable to pay up front or when they received care. Among households with medical debt, the median amount owed was $2,000, meaning half had more and half had less.
Like other debt, medical debt means that households have less money to spend on other essential items, such as food and housing. People with medical debt, or at risk of accumulating medical debt, may also forgo needed medical care or treatment. Medical debt can also lead to bankruptcy.
Who Has Medical Debt?
Race, ethnicity, age, education, poverty and other characteristics reported in the SIPP are associated with health, social and economic factors that contribute to whether households carry medical debt.
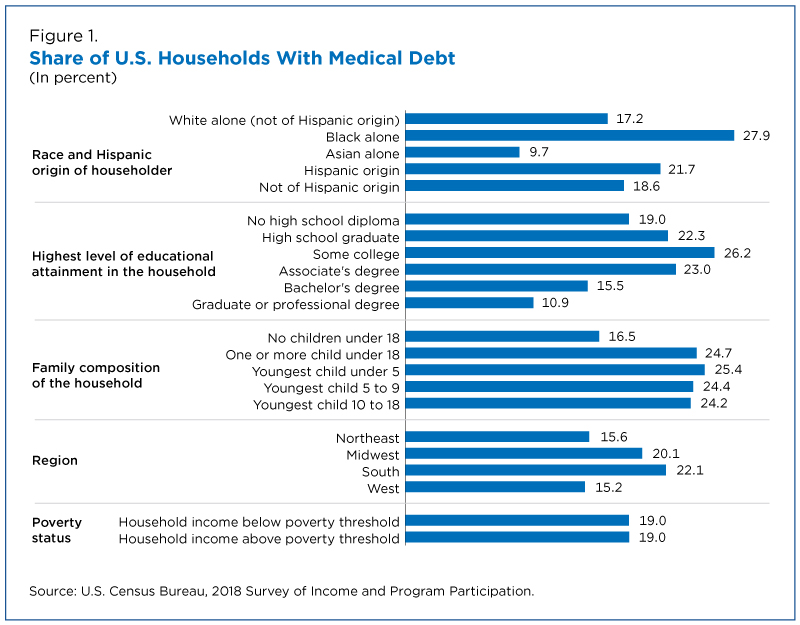
For example, according to the survey, 27.9% of households with a Black householder had medical debt compared to 17.2% of households with a White non-Hispanic householder and 9.7% of households with an Asian householder (Figure 1).
Households with a householder of Hispanic origin were also more likely to hold medical debt (21.7%) than households without (18.6%).
Households most likely to carry medical debt (26.2%) were those in which the highest level of education of any of the members was some college but no degree.
Households where the highest level of education of any member was a bachelor’s or graduate/professional degree were among the least likely to report having medical debt (15.5% and 10.9%, respectively). However, the share of medical debt did not always decrease with years of education.
Households with children under age 18 (24.7%) were more likely than those without children (16.5%) to carry medical debt.
Just over a quarter (25.4%) of households with the youngest child under the age of 5 held medical debt. This was not statistically different from households in which the youngest child was between the ages of 5 and 9 or between 10 and 18 (24.4% and 24.2%, respectively).
Regionally, 22.1% of households in the South reported having medical debt compared with 15.2% of households in the West and 15.6% in the Northeast. In the Midwest, 20.1% of households reported having medical debt.
There was no difference in the share of households above and below the poverty threshold that reported having medical debt (19% in both groups).
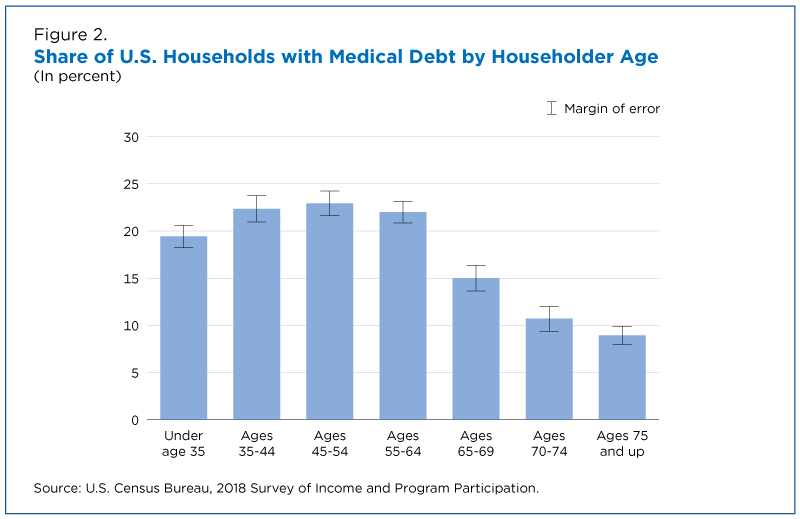
There also appears to be a link between age and medical debt. Households with a younger head of household were more likely to hold medical debt than those with an older head of household, according to the survey.
In Figure 2, for all age groups where the householder was under 65 years old, at least 20% of households held medical debt. The share narrowed in households headed by someone over 65, the age of Medicare eligibility, dipping to 15% for those ages 65 to 69 years, 11% for those ages 70 to 74, and 9% for those 75 and older (Figure 2).
Health, Disability and Medical Debt
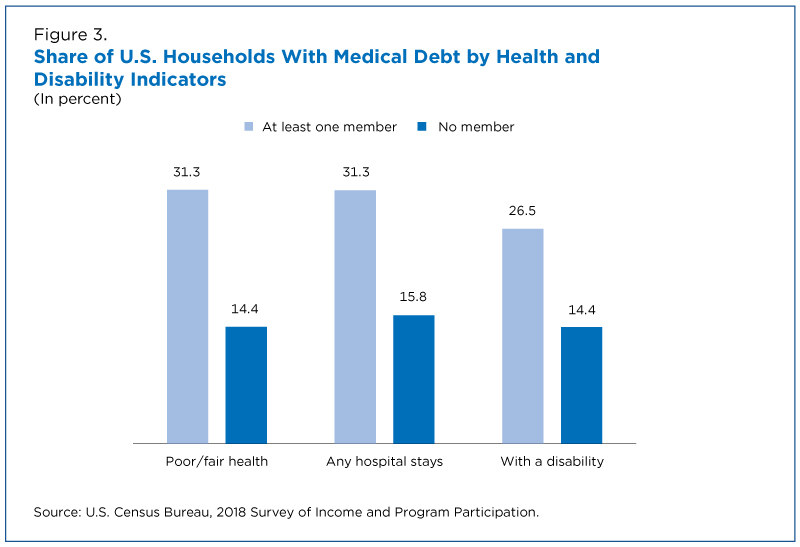
Differences in health status and hospital stays or having a disability may also contribute to medical debt.
About 31% of households with a member in fair or poor health had medical debt compared to 14.4% of those with no members in fair or poor health (Figure 3).
The share of households with medical debt was almost double for those with any member experiencing a hospital stay (31.3%) than for those with no members with a hospital stay (15.8%).
More than 1 in 4 (26.5%) households with at least one member with a disability had medical debt compared to 14.4% of households with no members with disabilities.
Health Coverage
The survey shows health insurance may protect individuals and households from high medical costs. Indeed, 16.2% of households with health insurance coverage for all members all year (fully insured) had medical debt compared to 30.8% of those that were not fully insured.
Households that did not have full health insurance coverage for the entire year had a median medical debt of $3,000, as opposed to $2,000 for households with full insurance coverage.
These estimates indicate that while fully insured households held less medical debt, they may still struggle to afford health care.
High Medical Debt
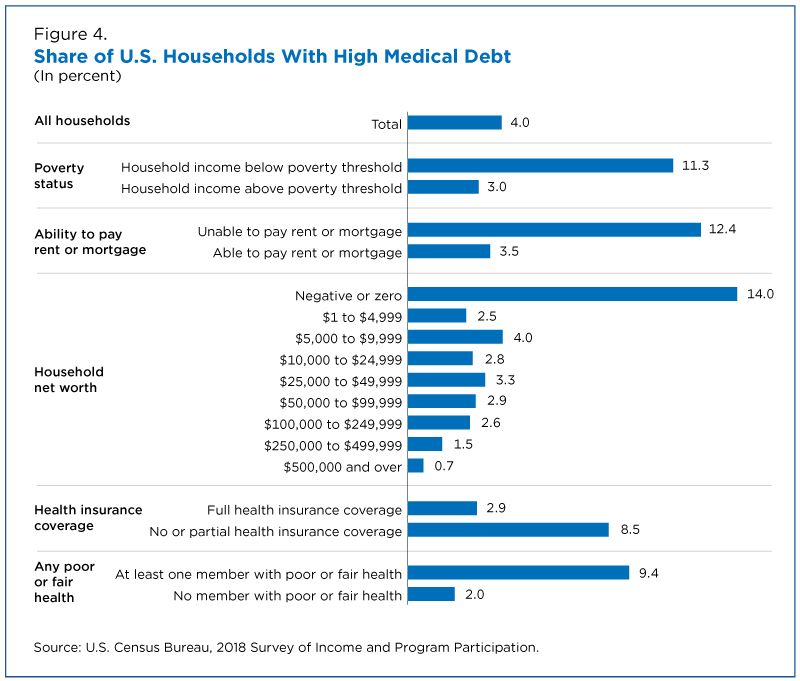
We define high medical debt burden as debt that exceeds 20% of a household's annual income.
Although just 4% of all households reported high medical debt burden, health and economic factors can also contribute to which households carry a high burden of medical debt.
As shown in Figure 4, 11.3% of households in poverty reported high medical debt burden compared to just 3% of households with incomes above the poverty threshold.
Households that had trouble paying their rent or mortgage also appeared to have trouble paying medical bills and were more likely to carry a high medical debt burden relative to other households (12.4% versus 3.5%).
A household’s net worth also seems to play a role in determining high medical debt.
Fourteen percent of households with zero or negative net worth had a high medical debt burden. In contrast, households with a net worth of $250,000 to $499,999 and $500,000 or above were among the least likely to have a high medical debt burden (1.5% and 0.7%, respectively).
Lack of health insurance is also key. The survey shows that 8.5% of households not fully insured reported high medical debt burden compared with 2.9% of households that were fully insured.
Not surprisingly, households with members in fair or poor health were also more likely to suffer high medical debt burden (9.4%) than their healthier counterparts (2%), as the medical care costs of those in worse health may be higher.
This article was filed under:
Subscribe
Our email newsletter is sent out on the day we publish a story. Get an alert directly in your inbox to read, share and blog about our newest stories.
Contact our Public Information Office for media inquiries or interviews.
Uninsured Rates Highest For Young Adults Aged 19 to 34
Adults ages 26 and 27 had the nation’s highest uninsured rates at 18.3% and 17.5%, respectively.
America Counts Story
Potential Impact of Stay-at-Home Orders on Health Insurance Rates
About 21.9 million workers in jobs more likely to be affected by stay-at-home orders and social distancing have health insurance through employers.
America Counts Story
Despite Unemployment Insurance, Many Households Struggle With Basics
The Household Pulse Survey shows that 31.2% of households that used unemployment insurance reported a very difficult time paying for usual household expenses.
More stories
Health
Dual Health Insurance Coverage Declining For Adults Age 65 and Over
Rates of dual health coverage — private health insurance and Medicare — decreased from 2017 to 2022 for adults age 65 and older regardless of employment status.
Population
Exploring Undercount of Young Children in 2020 Census by County
New experimental analysis and visualization shows a relationship between poverty and the undercount of young children.
Government
Bridge Collapse Could Affect Over a Million People in Baltimore Area
The Community Resilience Estimates show that 21.7% of residents in the combined areas of Baltimore city and County are considered socially vulnerable.
Population
Where Do Immigrants Live?
A new data visualization explores where immigrants live and how this changed over 10 years at the national, state and county levels.
Page Last Revised - June 7, 2023
✕
Is this page helpful?
 Yes
Yes
 No
No
 Yes
Yes
 No
No✕
NO THANKS
255 characters maximum
 255 characters maximum reached
✕
Thank you for your feedback.
Comments or suggestions?

Comments or suggestions?